PyParse Outputs#
Introduction#
PyParse generates multiple tables and visualisations as part of the analysis. These allow the user to draw conclusions as to the success or otherwise of the reaction. It also provides a standard layout for the output of the processed data for long term storage, searching, and machine learning.
The visualisations and logs are formatted into an easy-to-use HTML format. The entire output is also wrapped up into a zip file by default for ease of file sharing.
Heatmap#
The heatmap is coloured using the plot_type described in the figure caption, and is generated using matplotlib. A separate heatmap is generated for each plot type, and can be viewed in the HTML output file.
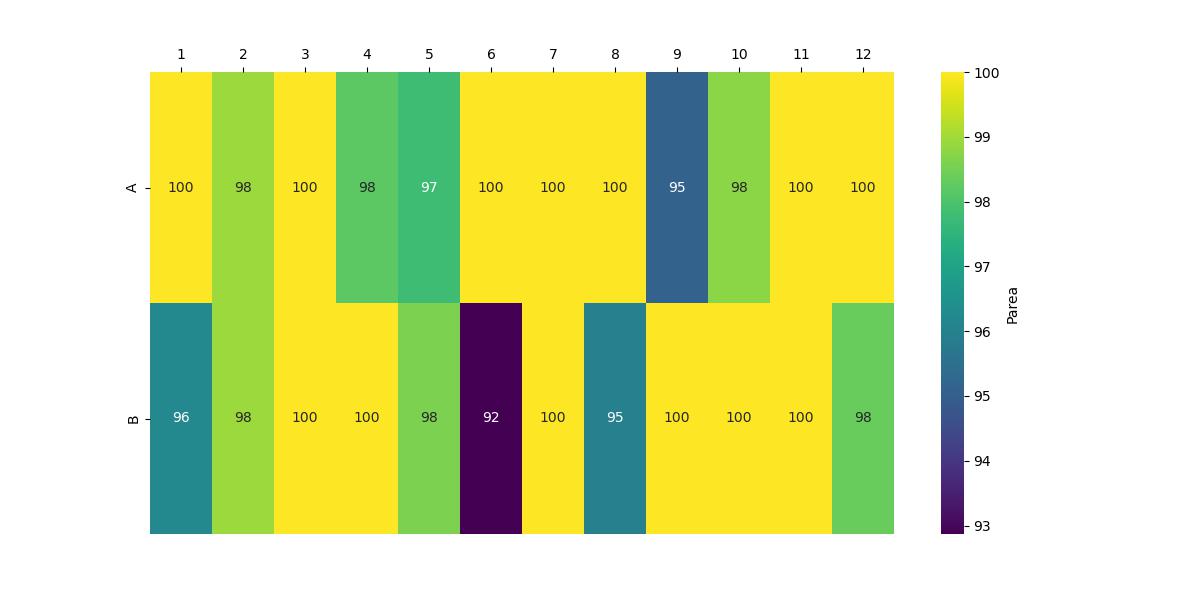
Example Heatmap#
Tip
See Plot Type Options for further details on the plot type parameter.
Trellised Pie-Charts#
A pie chart visualisation is also generated; each pie is sized according to the plot_type parameter, and the size of each wedge corresponds to the LCMS UV percentage area of the peak corresponding to that compound.
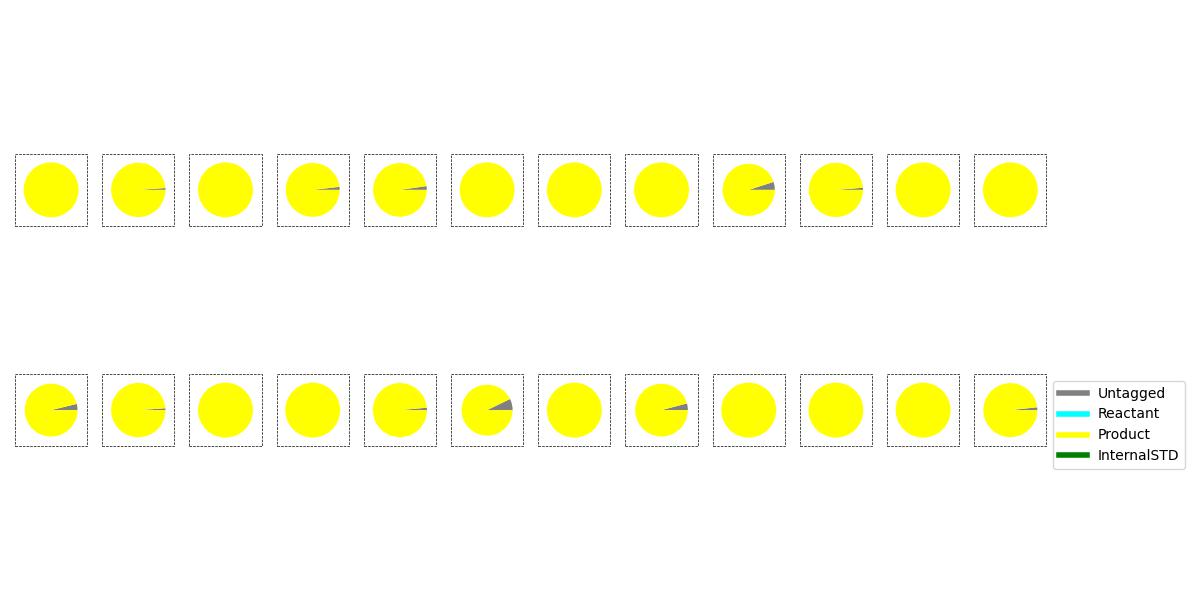
Example Trellised Pie-Chart Plot#
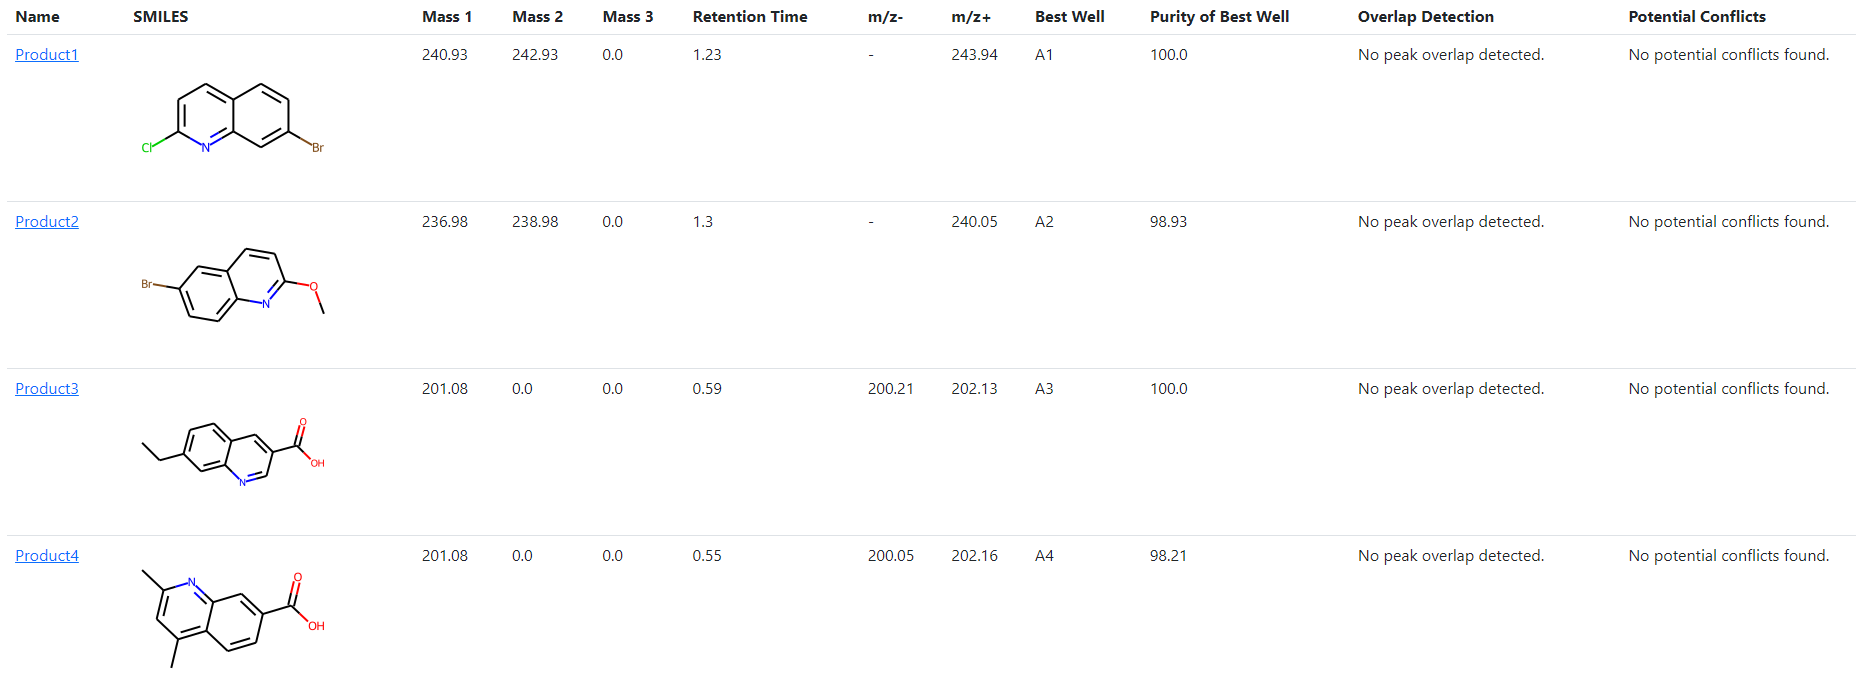
Compound Summary Table#
The compound summary table shows the compounds that were provided in the platemap with:
The name given to the compound
The structure, rendered using RDKit
The exact masses that were calculated (including halide isotope and Boc-degradation fragments)
The retention time observed for that compound
The m/z ions which were observed for that compound
The well which was deemed to be the best, depending on the plot_type parameter which was used
The purity by LCMS UV percentage area of the compound in the best well
Important
Doubly and triply protonated ions, such as [M+2H]2+ and [M+3H]3+, are not explictly described in this table, but are nonetheless calculated by PyParse and used to find hits from the LCMS data.
There are two further columns which PyParse populates in cases where the analysis was complicated by the data itself:
- Overlap Detection
PyParse notes cases where the peak found in the “Best Well” was found to overlap with another peak, i.e. a shoulder peak. This may impact the peak area described in the LCMS data file, and warns the user to carefully check the conclusion in this case.
- Potential Conflicts
There may be cases where the compound is found to have the same or similar retention time as another compound. In these cases, the compound may co-elute with another, affecting the reported purity. Whilst PyParse attempts to find all examples of co-elution, these can go undetected. Thus, PyParse warns the user that this is the case and that they should check the conclusions.
Hit Validation Graph#
This graph visualises all possible peaks that contain a m/z which correspond to that expected for that compound, across the entire plate.
It is designed to help spot trends across the plate and to point out to the user other possibilities which were ultimately discounted by the hit validation algorithm in PyParse.
Tip
This graph can be particularly helpful for quicking spotting plate where more than one regioisomer has been synthesised.
One hit validation graph is generated per compound
All hits (peaks which contain the desired m/z) are plotted by their retention time vs the well in which they were observed.
The size of the hit corresponds to the LCMS UV peak percentage area
Hits coloured in black are those which were used to generate the heatmap, pie-charts and other outputs
Hits coloured in red are those which were discarded by the hit validation algorithm, i.e. false positives.
Hits are shaped by the cluster to which they were assigned during validation.
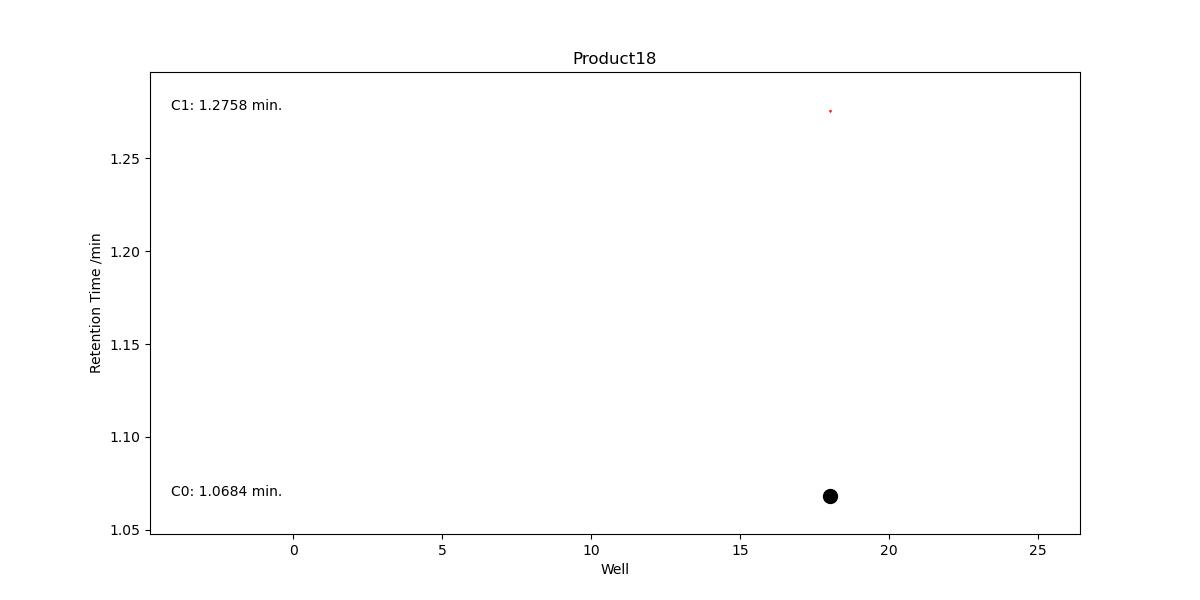
Example Hit-Validation Graph#
Important
A successful validation will produce a straight line of points in black, i.e. each peak used in the analysis had the same retention time.
In the HTML output, the logs that are pertinant to that compound are provided with the hit validation graph. Read through these logs to discover more about the hits that PyParse included, discarded, or marked as a “tentative” assignment due to their UV absorbance or m/z intensity deviating from what was the norm for that compound.