Installation and Run#
Pre-Requisites#
PyParse was written for Python v3.7, and the following packages should be installed if not already available:
matplotlib: https://matplotlib.org/stable/index.html (v 3.5.3)
seaborn: https://seaborn.pydata.org/ (v 0.12.1)
pandas: https://pandas.pydata.org/ (v 1.3.5)
rdkit: https://rdkit.org/docs/api-docs.html (v 2020.09.1)
jinja2: https://jinja.palletsprojects.com/en/3.1.x/ (v 3.1.2)
numpy: https://numpy.org/ (v 1.21.5)
The suggested version of each package is provided in parentheses. A conda text/yml file is provided as part of the Github repository. PyParse has also been tested and used in Python version 3.11 using up to date versions of the above libraries.
PyParse is currently capable of analysing LCMS data in the Waters OpenLynx™ browser report (.rpt) file format (single file for the whole plate), or LCMS data saved in the .daml file format from Shimadzu machines (one .daml file per well). All data for the analysis must be in one of these two formats.
Preparing a Platemap#
To run the analysis correctly, PyParse requires a platemap detailing the structures of the materials that are expected in each well. This platemap should be provided as Comma-Separated-Values (.csv) file.
As a minimum, the structure of the desired product expected in each well is required, provided as a SMILES string:
Well |
Desired product SMILES |
|---|---|
A1 |
CN(C)c1ccccc1 |
A2 |
CN(C)c1ccccc1 |
A3 |
CN(C)c1ccccc1 |
A4 |
CN(CC)c1ccccc1 |
A5 |
CN(CC)c1ccccc1 |
A6 |
CN(CC)c1ccccc1 |
You can also, optionally, specify the structure of the internal standard as well as the structures of any byproducts and the limiting reactant that may be expected. Add additional columns into the platemap using the following headers:
InternalSTD SMILES
Limiting Reactant SMILES
Byproduct1 SMILES
ByProduct2 SMILES (etc)
Note
You can only specify a single product and limiting reactant in a well, though multiple of each can appear across a plate.
Multiple byproducts can be listed for a well, but each byproduct should appear in its own column. This may result in some cells in the platemap table being empty, where a particular byproduct cannot be observed in that well. This is expected behaviour.
Caution
Only a single internal standard (InternalSTD SMILES) can be specified for a given plate.
Further detail can be provided in the platemap by the addition of a retention time and a name for each material. This is done by adding “RT” or “Name” respectively after the compound class in the column header, e.g.
Desired Product Name
Desired Product RT
Byproduct3 Name
Note
All column headers are case insensitive, but must otherwise match exactly the names given here.
Well |
Desired Product SMILES |
Desired Product Name |
Limiting Reactant SMILES |
Limiting Reactant RT |
InternalSTD SMILES |
Byproduct1 SMILES |
Byproduct2 SMILES |
|---|---|---|---|---|---|---|---|
A1 |
CN(C)c1ccccc1 |
DiMethyl Product |
Brc1ccccc1 |
1.01 |
Fc1ccccc1 |
Oc1ccccc1 |
|
A2 |
CN(C)c1ccccc1 |
DiMethyl Product |
Brc1ccccc1 |
1.01 |
Fc1ccccc1 |
Oc1ccccc1 |
|
A3 |
CN(C)c1ccccc1 |
DiMethyl Product |
Brc1ccccc1 |
1.01 |
Fc1ccccc1 |
Oc1ccccc1 |
|
A4 |
CCN(CC)c1ccccc1 |
DiEthyl Product |
Clc1ccccc1 |
0.95 |
Fc1ccccc1 |
c1ccccc1 |
|
A5 |
CCN(CC)c1ccccc1 |
DiEthyl Product |
Clc1ccccc1 |
0.95 |
Fc1ccccc1 |
c1ccccc1 |
|
A6 |
CCN(CC)c1ccccc1 |
DiEthyl Product |
Clc1ccccc1 |
0.95 |
Fc1ccccc1 |
c1ccccc1 |
Specifying a Retention Time in the Platemap#
By specifying a retention time in the platemap, PyParse can be guided to use only the peaks which are present close to that time.
In a typical analysis, there may be many sets of peaks which contain the m/z which corresponds to that compound. In the below example, a retention time of 0.73 min is provided in the platemap, which forces PyParse to use only peaks at or close to that retention time.
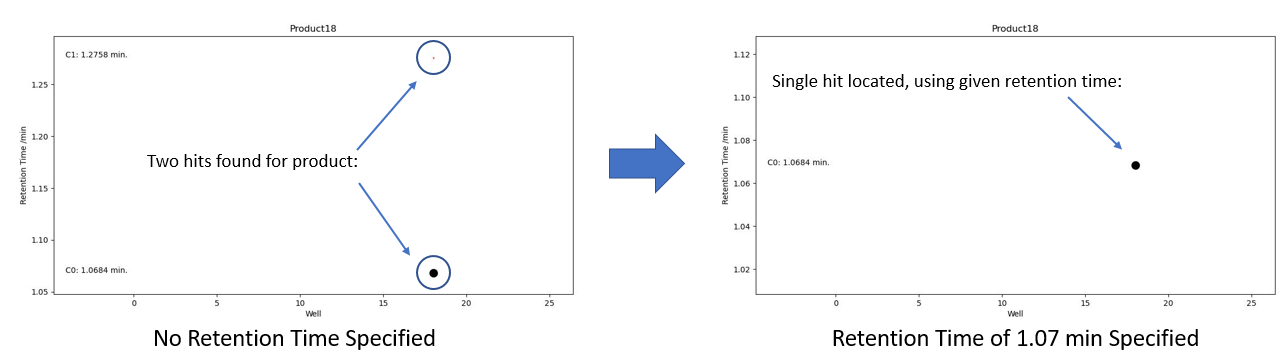
Figure 1. Hit validation graph before and after a retention time is specified#
Tip
See the section on PyParse Outputs for further information about Hit Validation Graphs.
Running a PyParse Analysis#
PyParse has been written as a standalone script and called from the command line, to carry out the automated analysis of a single reaction plate at a time.
Each analysis should specify, at a minimum, the locations of the LCMS data and the platemap. By default, the output of this run will be saved in a new folder called “output” in the current working directory.
python PyParse.py example_rpt.rpt example_platemap.csv
python PyParse.py folder_containing_daml_files example_platemap.csv -i Shimadzu
Note that for data generated using a Shimadzu machine, the instrument (-i) must be specified.
Commonly Used Optional Parameters#
PyParse is now configured to determine the number of rows and columns in the plate for data obtained from both Waters and Shimadzu machines. Furthermore, it generates heatmaps for all different plot types by default.
The below options allow you to adjust the number of rows and columns in the heatmaps [-r and -c] (e.g. only the top left of the physical plate contained samples), adjust the default output folder [-o], and specify an alternative metric to determine the “best well” for a compound [-pt]
Use the following optional parameters to change each of these:
-o: specify the output_directory
-r: specify the number of rows in the plate
-c: specify the number of columns in the plate
-pt: specify the metric by which different wells should be compared. The following options are available:
Parea: Compare wells by their LCMS UV percentage area of product
P/SM+P: Compare wells by their ratio of product to the sum of starting material and product, using UV area absolute
P/STD: Compare wells by their ratio of product to internal standard, using UV area absolute
corrParea: As Parea, but normalised to the maximum value observed for that product
corrP/SM_P: As P/SM+P, but normalised to the maximum value observed for that product
corrP/STD: As P/STD, but normalised to the maximum value observed for that product