Automatic Impurity Detection and Reporting#
Background#
For a plate of reactions, there will typically be at least one reagent which is commonly used across multiple wells of the plate. With this commonality comes a higher chance that a particular by-product or side-product (generically termed “impurity” for simplicity) is synthesised across multiple wells.
Compared to single reactions that compare One Variable At a Time (OVAT), high-throughput experimentation generates large quantities of data in a single experiment. What was previously a one-off impurity can become an observation backed up by data from multiple reactions.
PyParse, through the hit-validation algorithm, overlays all peaks that weren’t assigned to a compound specified by the user and identifies those that frequently occur.
C-H Activation Reaction Optimisation Plate#
Note
For further details on the reaction optimisation plate described below, see: Mason J., Wilders H., Fallon D.J., Thomas R.P., Bush J.T., Tomkinson N.C.O., Rianjongdee, F.; Automated LC-MS Analysis and Data Extraction for High-Throughput Chemistry; Digital Discovery (2023), 2, 1894 - 1899; https://doi.org/10.1039/D3DD00167A
Using high-throughput experimentation, a small dataset for the C-H activation of an oxazole was prepared and published as part of the PyParse repository.
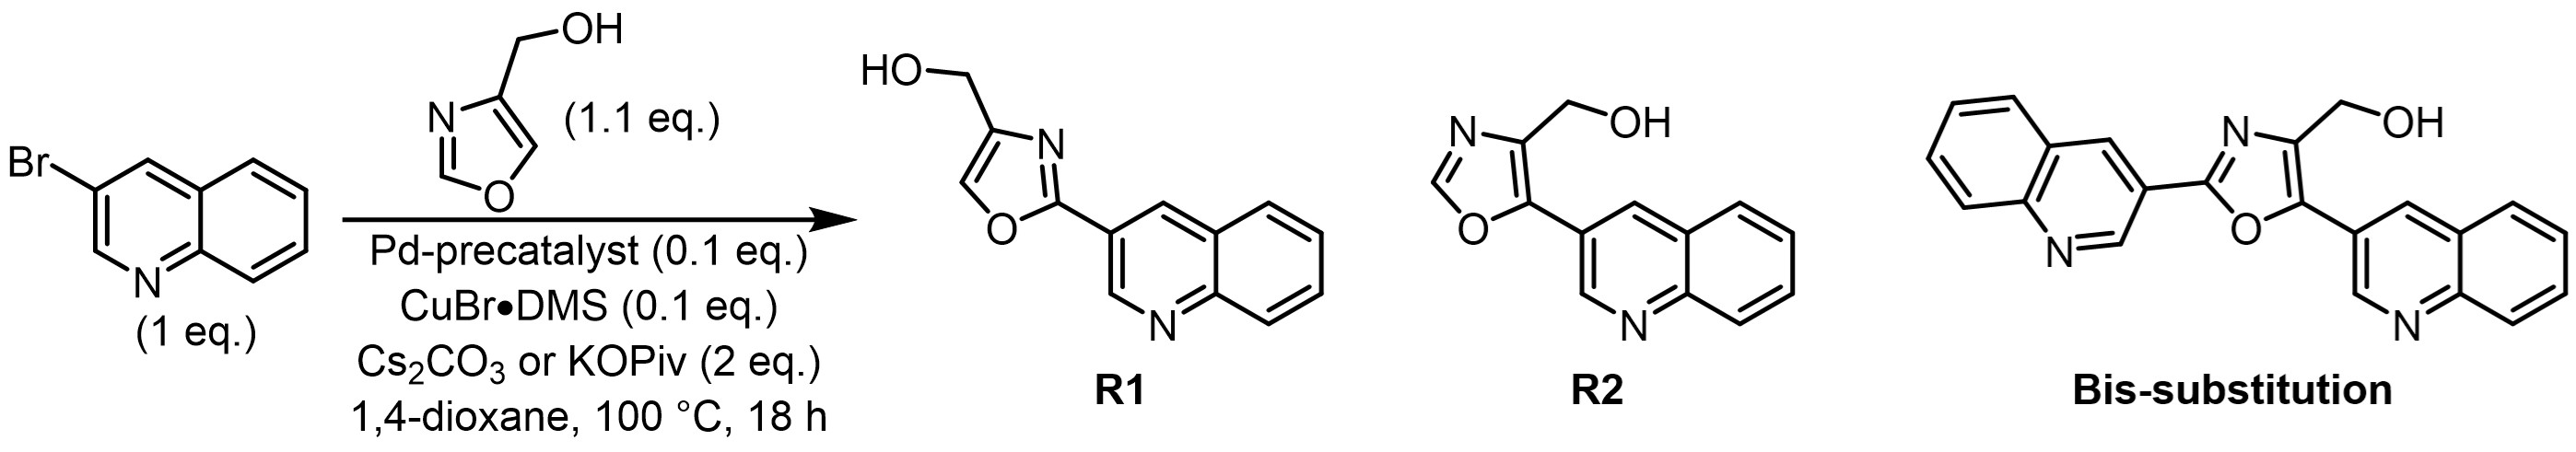
Scheme 1. Reaction Design for C-H Activation Optimisation#
In the course of running the experiment, it was expected that both regioisomers (R1 and R2) and the bis-substitution side-product would likely be synthesised in the plate. This was indeed observed and the two regioisomers were confirmed by isolation of the each product and structure assigned by ROESY (see the open-access paper referenced above for further details).
In v1.1.0 of PyParse, the “find_impurities” function is designed to draw the user’s attention to commonly observed impurities. The goal of this function is to enable the user to generate new hypotheses more quickly than would otherwise be possible, by reporting the data in a more digestible form.
The first step of this function is to generate the hit validation graph for all impurities. This graph is independant of any m/z ions that were observed at this stage - it simply groups all peaks (that weren’t already assigned to compounds specified in the platemap) by their retention time.
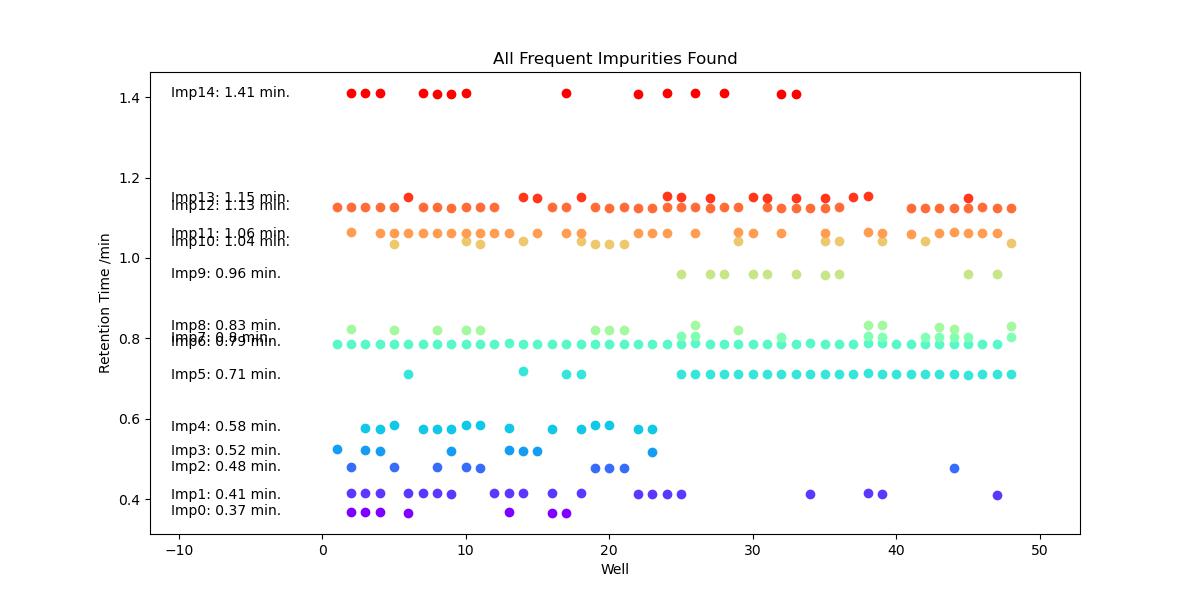
Figure 1. Hit Validation Graph for Reaction Optimisation Plate#
In this graph, multiple impurities form lines on the graph at a specific retention times; this consistency across multiple wells suggest that the impurity observed in each well may be the same. For example, impurities 6, 13 and 14 are all observed in numerous wells with a tight retention time. For these impurities, we have both quality data to build confidence in any conclusions we draw, and there is a greater expected reward for determining the structure of an impurity which consistently hampers the desired transformation.
We’ll start with these impurities and use the impurity table to find the m/z values for each. PyParse only reports m/z ions that were observed in at least 80% of the peaks assigned to that impurity. This helps to filter out the noise so that the user can focus on key data rather than “red herrings”.
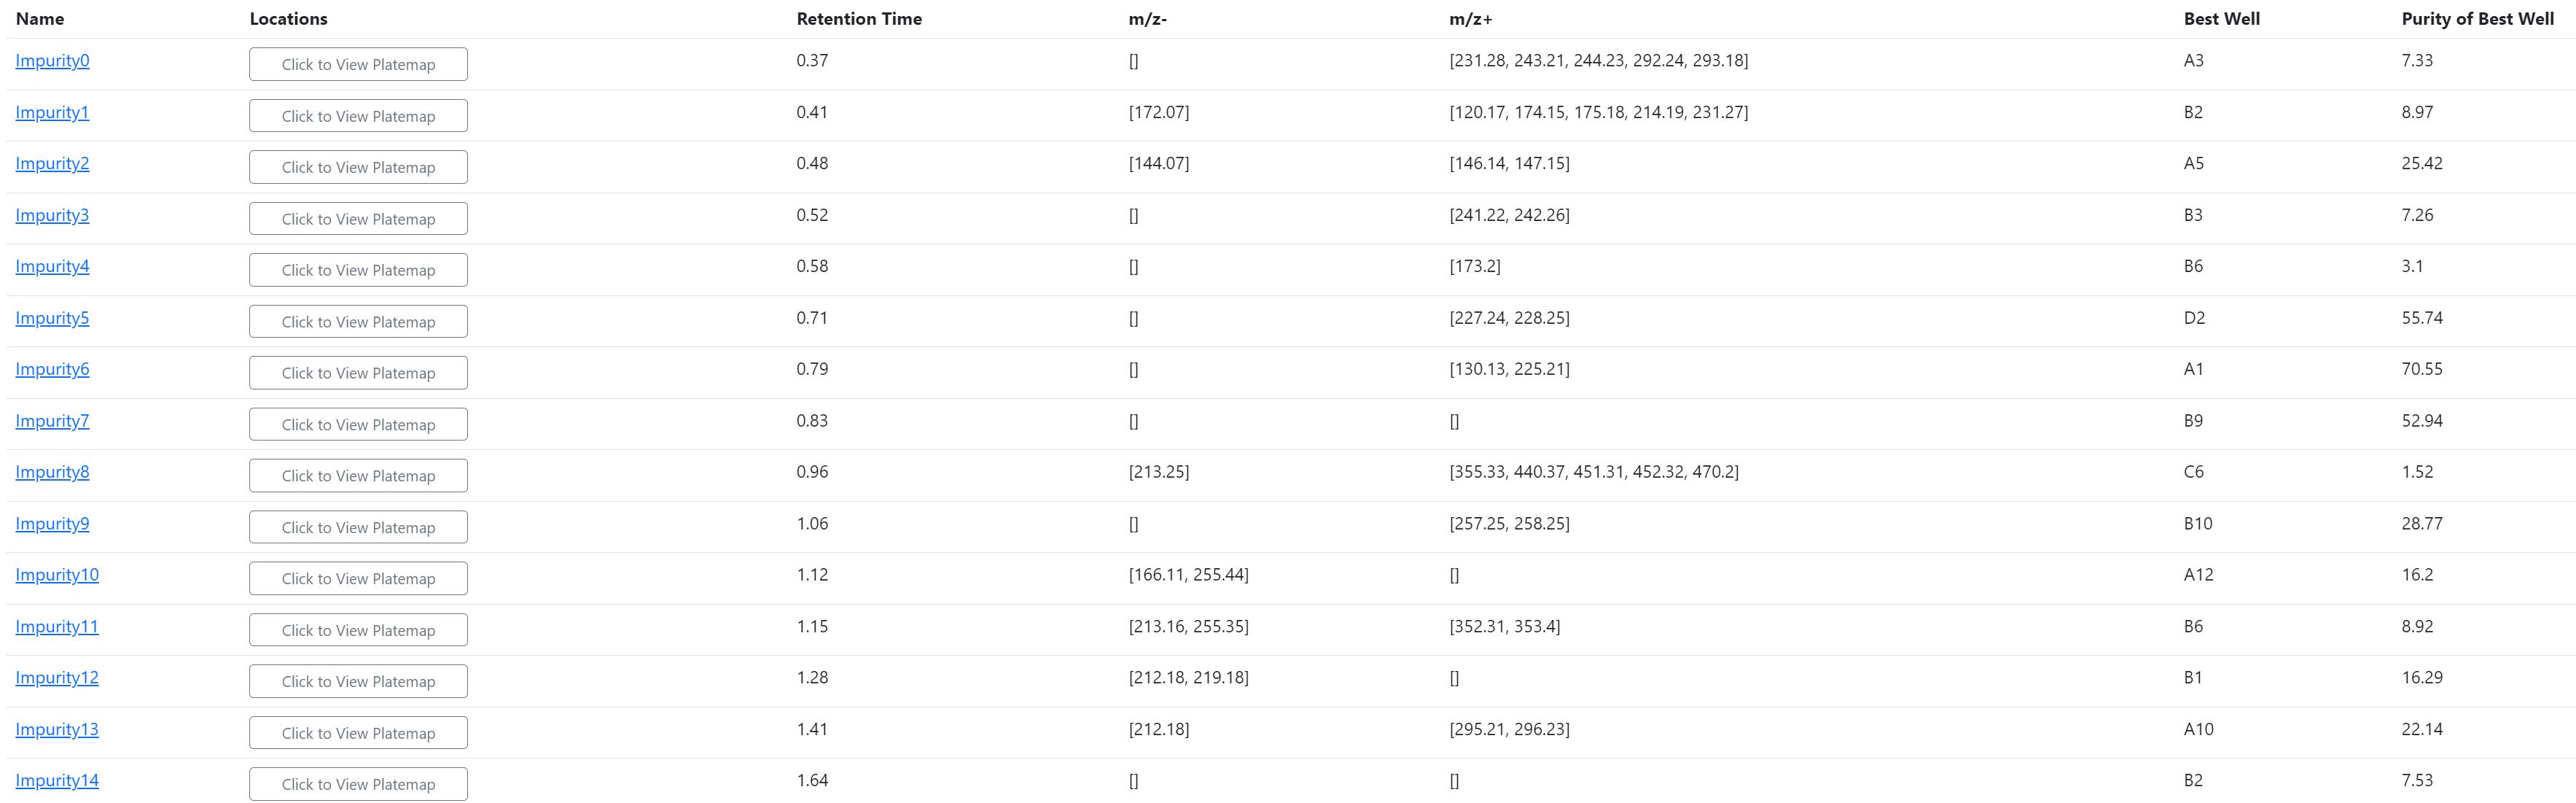
Table 1. Impurity Table for Reaction Optimisation Plate#
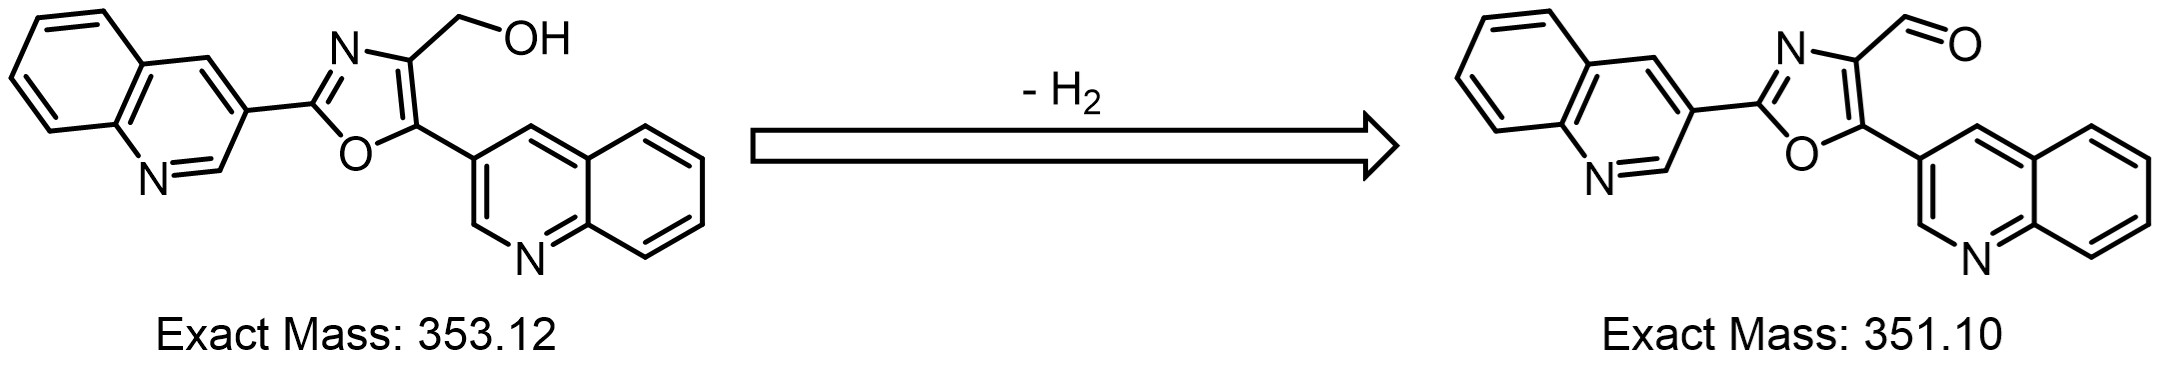
At this point, we need to use our knowledge of common chemical transformations to build hypotheses on what these impurities could be. Starting with impurity 6, a m/z of 225 (ES+) is observed in >80% of the peaks; this is 2 units less than that observed for the desired product (R1/2, Scheme 1) and suggests an oxidation mechanism may be in effect. A plausible suggestion is that oxidation of the benzylic alcohol to the corresponding aldehyde has occurred.
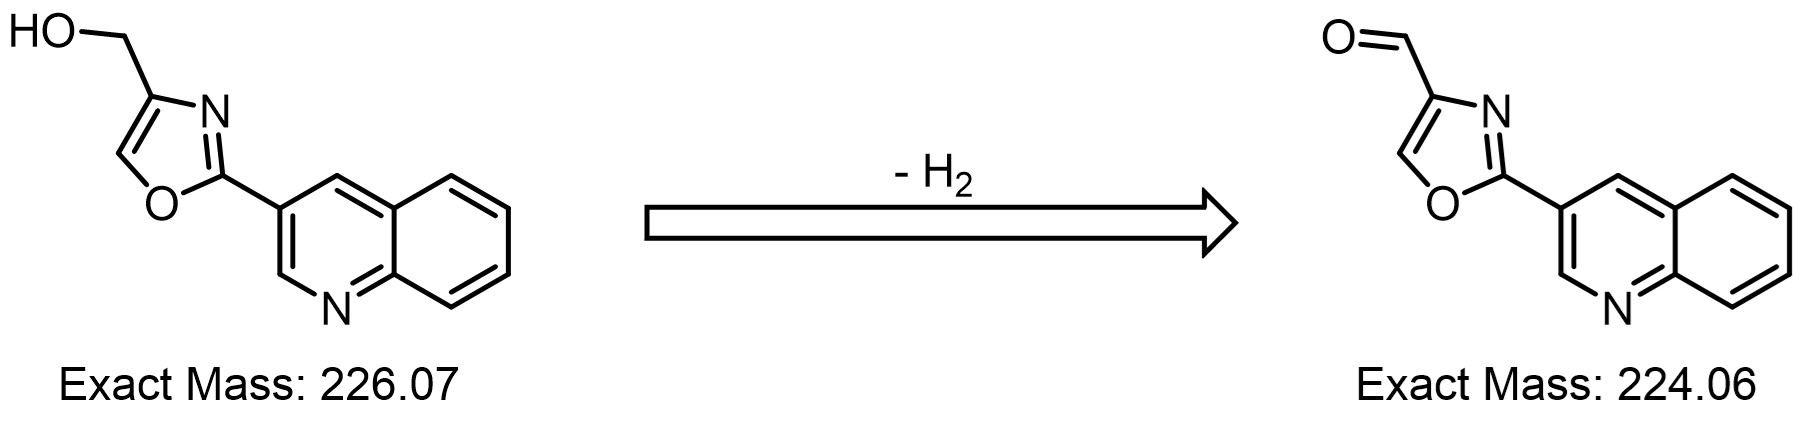
Scheme 2. Hypothesised Oxidation Scheme of the Desired Product to give Impurity 6#
This mechanism is certainly unusual and it must be noted here that any assignments based on m/z values should be followed up with more robust analytical techniques (e.g. 1H NMR) to verify these conclusions. However, using PyParse in this way has allowed us to more quickly identify the retention time and mass of this impurity.
Using the same technique, we can build a similar hypothesis for impurity 13:
Scheme 3. Hypothesised Oxidation Scheme of the Bis-Substituted Side-Product to give Impurity 13#
Finally, using knowledge of the Buchwald G3-type precatalysts that were used in certain wells of the reaction optimisation plate (see cited paper above), PyParse helps us to assign a tentative structure for impurity 14:
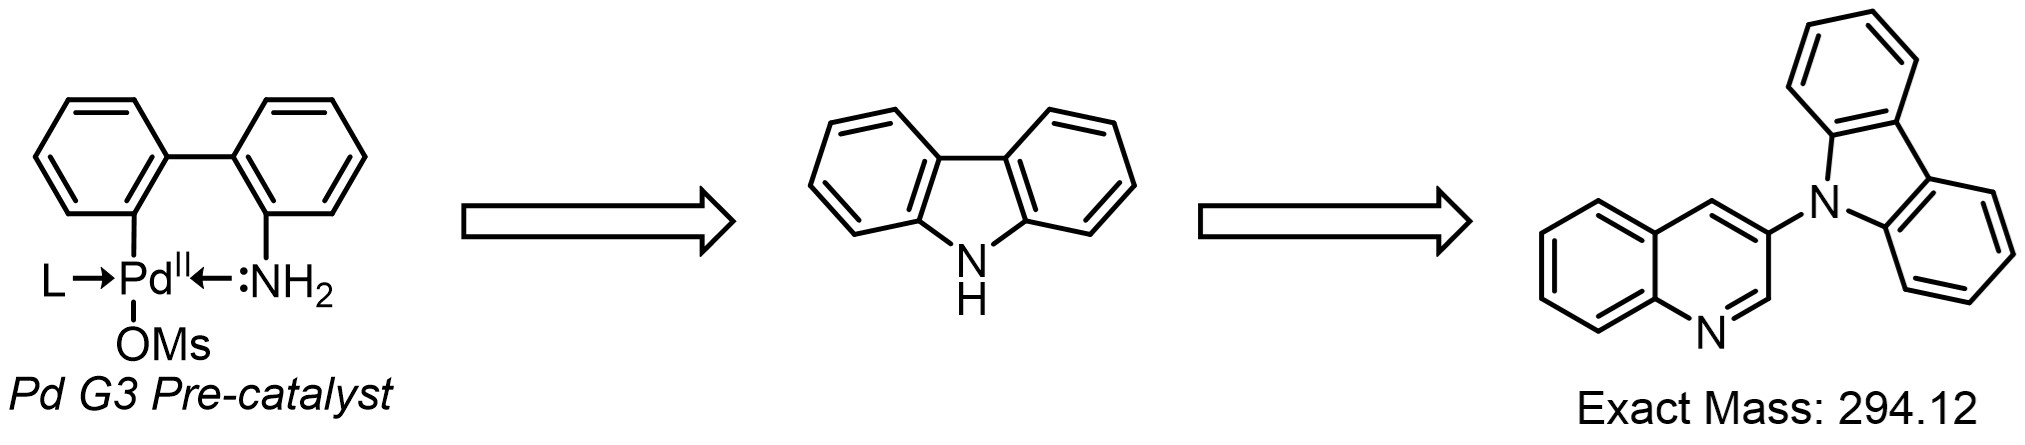
Scheme 4. Hypothesised C-N Cross-Coupling to Generate Impurity 14#
This C-N cross coupling side product is not unusual when using the Generation 3 type pre-catalysts: we can hypothesise that using the Generation 4 pre-catalyst instead would help us to further improve the yield of the desired product (R1, scheme 1).
Note
For further details on Generation 4 pre-catalysts, see: Bruno N.C., Niljianskul N., Buchwald S.L.; N-Substituted 2-Aminobiphenylpalladium MethaneSulfonate Precatalysts and Their Use in C-C and C-N Cross Couplings; J. Org. Chem. (2014), 79 (9), 4161-4166; https://doi.org/10.1021/jo500355k.
Conclusions#
The PyParse “find_impurity” function is not designed to replace the trained chemist, but instead take advantage of the rich dataset that has been generated and highlight key data to the user. Without a doubt, the same process could be performed manually, but would be a tedious and labour-intensive process. Using PyParse in this fashion allows new hypotheses to be generated more rapidly and gives back time to the user to focus on cutting edge research.