Using the Example Dataset#
Introduction#
To help you get started, an example dataset from a Waters machine is provided in the repository under the folder “example_dataset”.
- Included are:
An “example_rpt” file, which includes the LCMS traces for 24 compounds published in the public domain.
An “example_platemap” file, which is the corresponding platemap to enable PyParse analysis of the above data.
The output you should expect to see
Using the conda environment provided, you can use the sample data to run your first PyParse analysis!
python PyParse.py example_dataset/Waters/Example1/example_rpt.rpt example_dataset/Waters/Example1/example_dataset/example_platemap.csv -o example_dataset/Waters/Example1/example_dataset/output -moa area
The “-moa area” specifies to the PyParse algorithm that where there are two peaks that could correspond to the product, choose the one with the larger percentage peak area.
A different example dataset obtained using a Shimadzu machine is also provided, under the example_dataset/Shimadzu folder.
python PyParse.py example_dataset/Shimadzu example_dataset/Shimadzu/Platemap.csv -o example_dataset/Shimadzu/output -i Shimadzu
Expected Output#
Once the analysis is complete, navigate to the “example_dataset” folder, where you should find a new sub-folder called output. Open this folder, and double-click on the “html_output” file. The HTML report will open, and contain the following visualisations.
You can also find these visualisations, and the underlying processed data, in the same subfolder.
Heatmap#
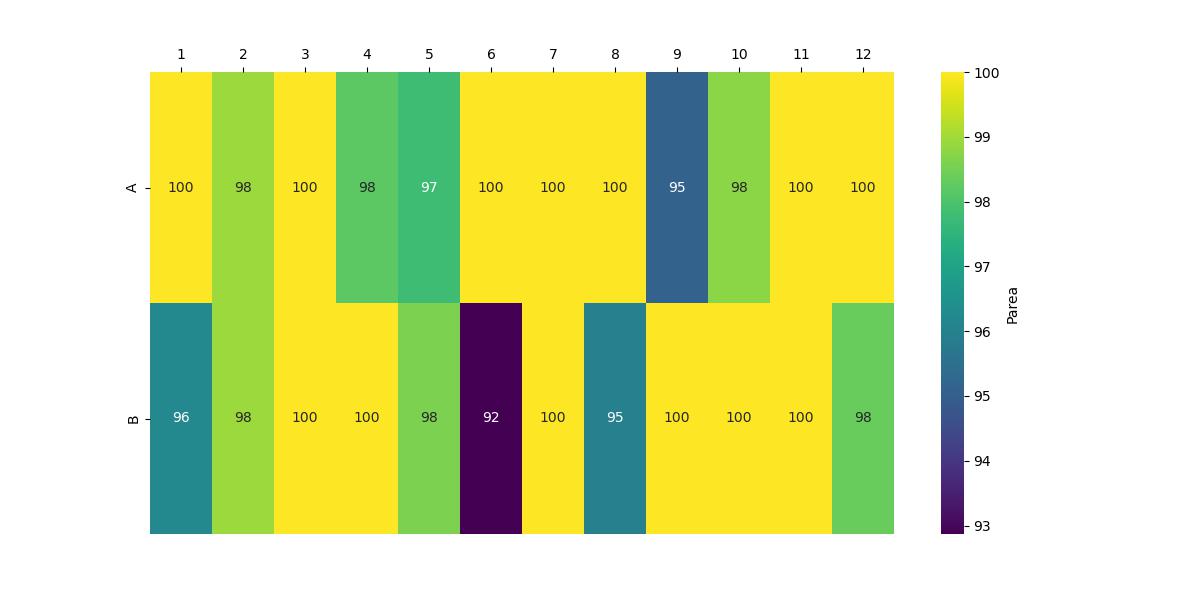
Example Heatmap#
Check to make sure that your heatmap looks the same as the one shown above. If so, you are ready to begin your own analyses!!